> For the complete documentation index, see [llms.txt](https://docs.pulseinsights.com/llms.txt). Markdown versions of documentation pages are available by appending `.md` to page URLs; this page is available as [Markdown](https://docs.pulseinsights.com/configuring-pulse-insights-console/reporting/free-text/responses-and-tagging.md).
# Responses & Tagging
## Free Text Viewer
For a more in depth analysis of free text responses, click on the “Text Responses” link in the bottom left.
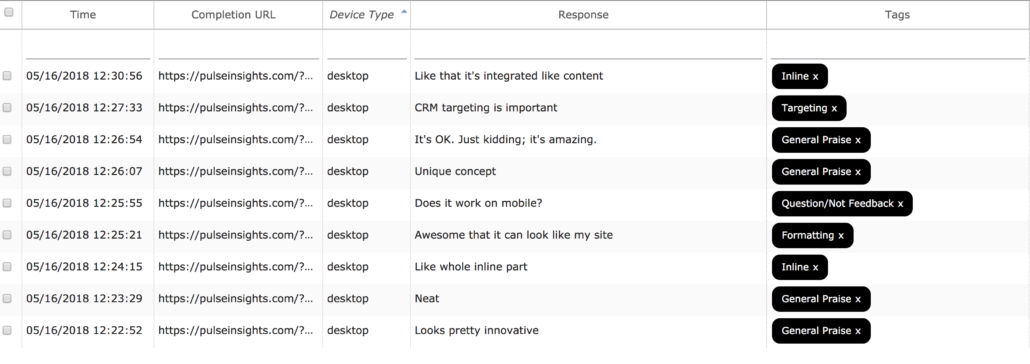
Clicking this link displays individual responses in a table format where you can see the date & time, completion URL, device type, response, translation (when applicable and language code is established upon survey creation), tags and sentiment score.
The data table is sortable by clicking a column header.
You can also filter results by typing in the filter field at the top of each column.
To **filter responses** simply type in the filter field at the top of the column you would like to filter.
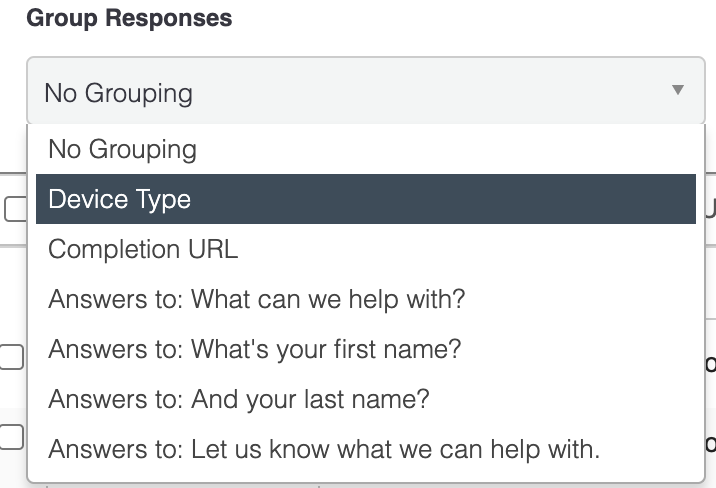
The data table also enables you to **group responses** so you can view the data in ways that highlight similarities, differences, and insights. For example, you can group the responses based on
* How the user answered some other question.
* The URL the user answered the survey on (only for browser-based responses; native mobile and API responses won’t have a submission URL)
* The device type (phone, tablet, and desktop)
## Tagging
You can also **tag free text responses.** When you have thousands of free text responses, it’s not easy to distill it into digestible learnings. And even if you could do that, it’s not easy to retain perspective about how common certain themes are. This is where our response tagging comes in.
### Manually Applying Tags
To apply one or more tags to a response:
1. Filter by relevant keyword by typing in the filter field at the top of “Tags” column
2. Using the checkbox in the leftmost column, select all responses as a starting point; but unchecking any responses that don’t fit
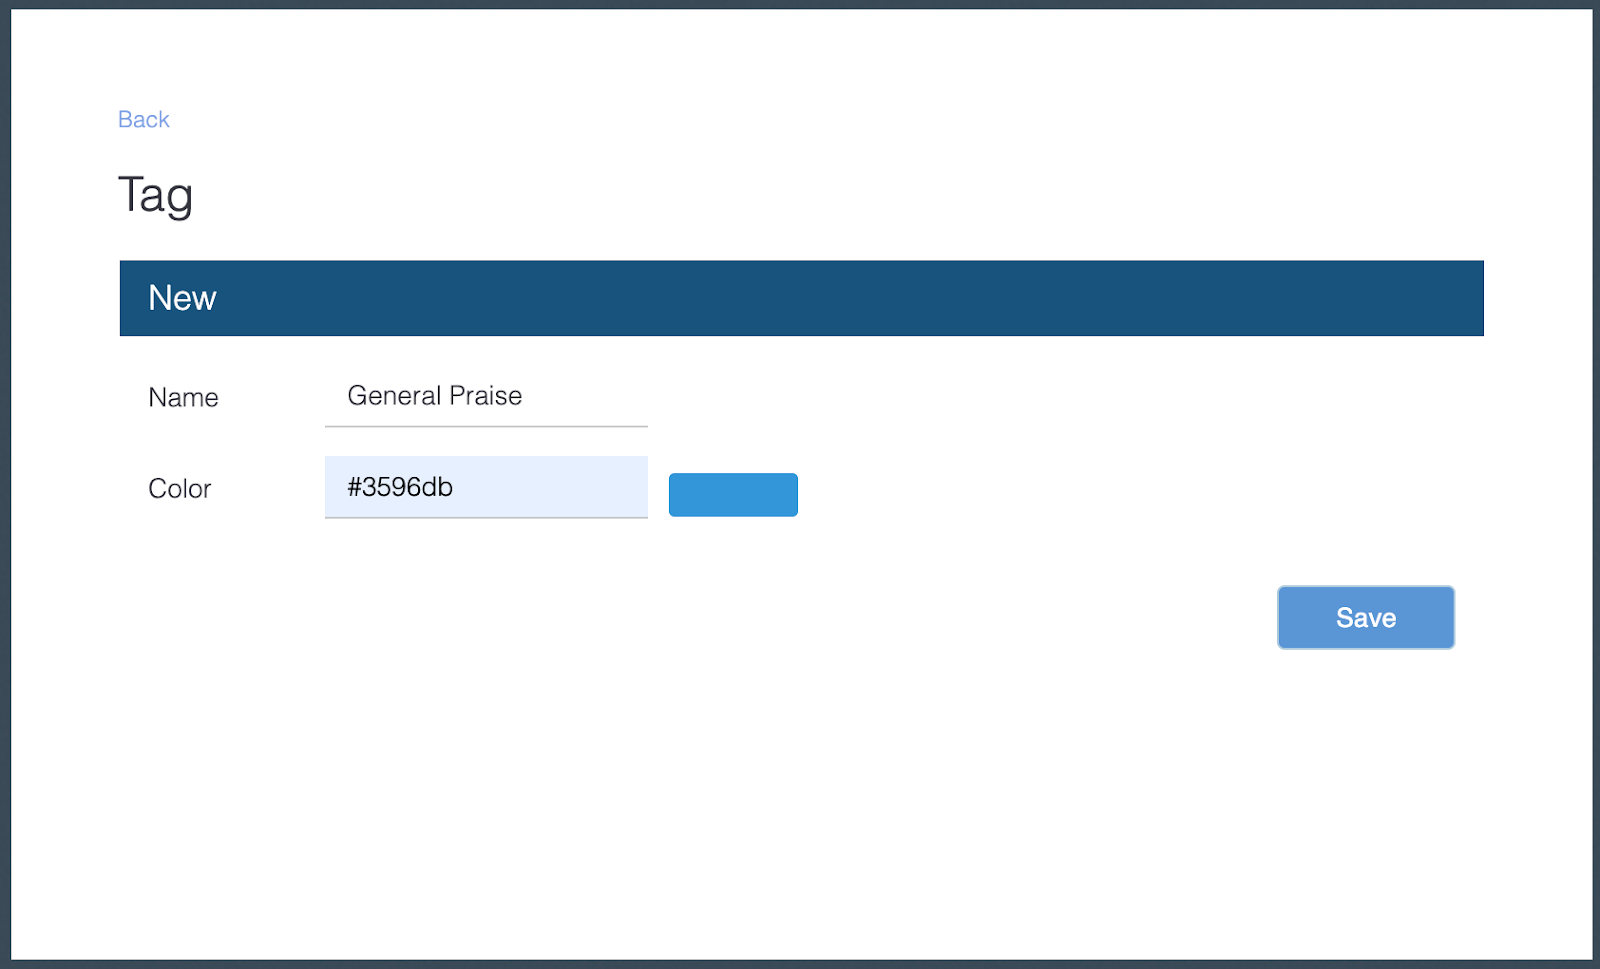
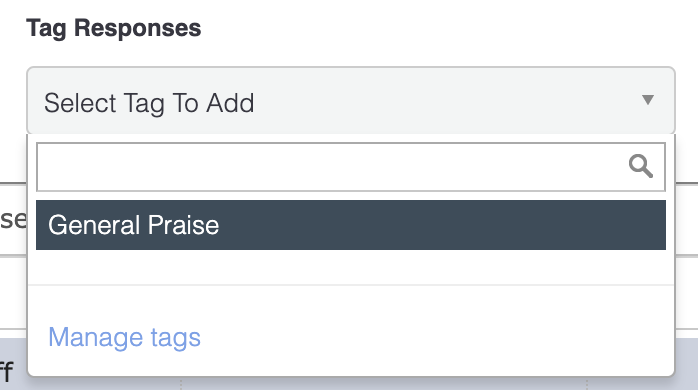
3. Apply the tag by choosing an option in the “Select tag to add” dropdown menu. To create a new tag, click “Manage Tags” in the dropdown menu. Then click “New Tag” and you can name your new tag and apply a tag color.
4. You can remove a tag by clicking the “X” on the tag
We’ve found that even large datasets with thousands of responses can be fully tagged quickly. \
The general results page will show a chart that graphs the frequency of occurrence of each tag in descending order, thus helping you digest what people think even though they submitted nuanced and complex open-ended responses.
### AutoTag
After you have created your tag labels and manually tagged a few responses for each tag type, you can AutoTag the rest and turn on AutoTag for any new responses that come in.
{% hint style="info" %}
This feature must be enabled by Pulse Insights for your account. For more details see [here](/configuring-pulse-insights-console/account-level-settings/configured-by-pulse-insights.md).
{% endhint %}
You can read our statement on AI and Ethics [here](https://www.pulseinsights.com/policies/ai).
---
# Agent Instructions
This documentation is published with GitBook. GitBook is the documentation platform designed so that both humans and AI agents can read, navigate, and reason over technical content effectively. Learn more at gitbook.com.
## Querying This Documentation
If you need additional information that is not directly available in this page, you can query the documentation dynamically by asking a question.
Perform an HTTP GET request on the current page URL with the `ask` query parameter, and the optional `goal` query parameter:
```
GET https://docs.pulseinsights.com/configuring-pulse-insights-console/reporting/free-text/responses-and-tagging.md?ask=&goal=
```
`ask` is the immediate question: it should be specific, self-contained, and written in natural language.
`goal` is optional and describes the broader end goal you are ultimately trying to accomplish on behalf of the user. GitBook uses it to tailor the answer towards what is most useful for that goal.
The response will contain a direct answer to the question and relevant excerpts and sources from the documentation.
Use this mechanism when the answer is not explicitly present in the current page, you need clarification or additional context, or you want to retrieve related documentation sections.